Are you tired of spending hours creating complex charts and graphs? Say goodbye to manual data visualization and say hello to ChartAI – the revolutionary AI tool that will transform the way you create and analyze charts.
With its advanced features and intuitive interface, ChartAI takes the hassle out of data visualization, allowing you to focus on what really matters – gaining insights and making informed decisions. In this article, we will explore the key features of ChartAI, its real-world benefits, and even delve into its pricing models.
So, let’s dive in and discover how ChartAI can revolutionize your data visualization experience.
Features of ChartAI:
1. Intelligent Data Analysis:
ChartAI’s intelligent data analysis feature is a game-changer for anyone working with complex datasets. By leveraging advanced machine learning algorithms, ChartAI automatically identifies patterns, trends, and outliers in your data, allowing you to gain valuable insights with just a few clicks.
Whether you’re analyzing sales data, customer behavior, or market trends, ChartAI’s intelligent data analysis feature will save you countless hours of manual analysis and help you uncover hidden insights that can drive your business forward.
2. Interactive Chart Creation:
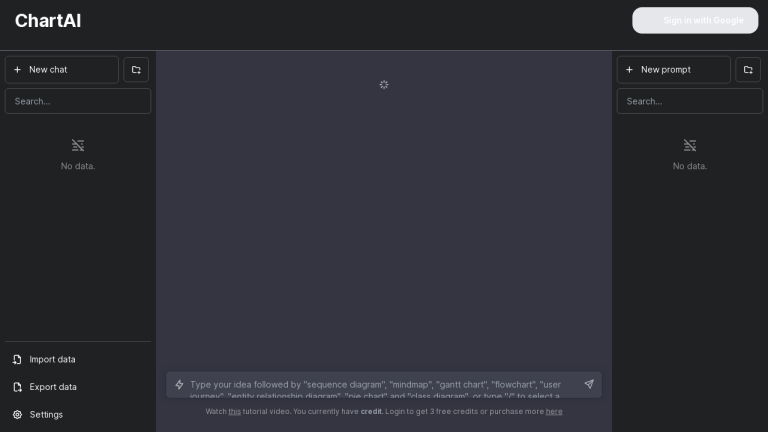
Gone are the days of static and boring charts. With ChartAI’s interactive chart creation feature, you can bring your data to life in a visually stunning and engaging way.
Whether you need a line chart, bar graph, pie chart, or any other type of chart, ChartAI’s intuitive interface makes it easy to create professional-looking charts that captivate your audience. Customize colors, labels, and annotations, and even add interactive elements like tooltips and drill-down capabilities.
With ChartAI, your charts will not only convey information effectively but also leave a lasting impression on your stakeholders.
3. Seamless Integration:
ChartAI understands the importance of seamless integration with your existing workflow. That’s why it offers robust integration capabilities with popular data analysis and visualization tools, such as Excel, Tableau, and Power BI.
Whether you’re importing data from a spreadsheet, connecting to a database, or exporting charts for presentation, ChartAI makes the process effortless. Say goodbye to manual data transfers and hello to a streamlined workflow that saves you time and effort.
4. Collaborative Sharing:
ChartAI recognizes the power of collaboration in data-driven decision-making. With its collaborative sharing feature, you can easily share your charts with colleagues, clients, or stakeholders.
Whether you want to share a live dashboard or export charts as image files or interactive HTML, ChartAI has got you covered. Collaborate in real-time, gather feedback, and make data-driven decisions together, all within the ChartAI platform.
Say goodbye to email attachments and version control headaches – with ChartAI, collaboration has never been easier.
ChartAI Pricing Models and Plans:
Unfortunately, the provided content does not include information about ChartAI’s pricing models and plans. However, rest assured that ChartAI offers a variety of flexible pricing options to suit different needs and budgets.
Whether you’re an individual user, a small business, or an enterprise, ChartAI has a pricing plan that fits your requirements. Visit the ChartAI website to explore the available pricing options and choose the one that best aligns with your data visualization needs.
Frequently Asked Questions:
1. Can I use ChartAI with my existing data analysis tools?
Absolutely! ChartAI offers seamless integration with popular data analysis tools like Excel, Tableau, and Power BI.
You can import data from these tools, use ChartAI’s powerful features for analysis and visualization, and even export charts to be used in your preferred data analysis environment.
2. Is ChartAI suitable for non-technical users?
Yes, ChartAI is designed to be user-friendly, even for non-technical users. Its intuitive interface and drag-and-drop functionality make it easy to create professional-looking charts without any coding or technical expertise.
ChartAI’s goal is to empower users of all skill levels to visualize their data effectively and make data-driven decisions.
3. Can I collaborate with others on charts created with ChartAI?
Absolutely! ChartAI’s collaborative sharing feature allows you to easily share your charts with colleagues, clients, or stakeholders.
You can collaborate in real-time, gather feedback, and make decisions together, all within the ChartAI platform. Say goodbye to cumbersome email attachments and embrace seamless collaboration with ChartAI.
Conclusion:
In conclusion, ChartAI is a game-changing AI tool that simplifies data visualization and analysis. With its intelligent data analysis, interactive chart creation, seamless integration, and collaborative sharing features, ChartAI empowers users to unlock valuable insights from their data and make informed decisions.
Whether you’re a data analyst, business owner, or a non-technical user, ChartAI’s user-friendly interface and powerful capabilities make it a must-have tool in your data visualization arsenal. Experience the power of ChartAI and take your data visualization to new heights.