Adcredo
Are you tired of juggling multiple advertising platforms and spending countless hours on reporting? Say goodbye to the hassle and

Are you tired of using frustrating chart editors on Google Sheets and Excel? Do you find manually coding up charts in Plotly to be a tedious task?
Well, we have the perfect solution for you – Chartify!
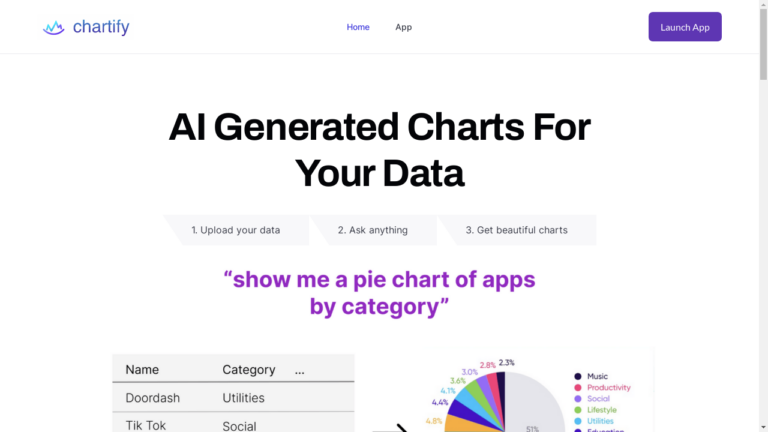
Chartify is a revolutionary AI tool that transforms the way you interact with your data. Say goodbye to complicated chart editors and hello to beautiful, AI-generated charts.
Whether you’re a data analyst, a business owner, or a student, Chartify is designed to make data visualization a breeze.
With Chartify, you can upload your data with just a few clicks. Whether it’s a CSV file or a connection to Postgres or MySQL, Chartify has got you covered.
No more wasting time on manual data entry or complex data formatting.
Once your data is uploaded, Chartify provides you with a range of AI-recommended visualizations. Gone are the days of staring at a blank chart canvas, wondering where to start.
Chartify takes the guesswork out of data visualization, offering you the best charts across platforms like Plotly, Matplotlib, Seaborn, and Charts.js.
But don’t just take our word for it. Users are raving about Chartify’s capabilities.
Amy X Lu, a PhD student at UC Berkeley, says, “Chartify is a powerful new way to talk to data, and I especially like how it generates all kinds of charts that I never considered.”.
So, whether you’re a data guru or a novice, Chartify is here to simplify your data visualization journey. Get ready to unlock the power of your data and create stunning charts with ease.
Chartify’s AI algorithms analyze your data and generate a wide range of charts that best represent your information. Gone are the days of manually selecting chart types and tweaking settings.
Let Chartify do the heavy lifting and present you with beautiful, ready-to-use visualizations.
Chartify allows you to effortlessly upload your data in various formats. Whether it’s a CSV file or a connection to popular databases like Postgres or MySQL, you can easily import your data into Chartify without any hassle.
Say goodbye to manual data entry and hello to seamless data integration.
With Chartify, you can ask anything about your data and get instant visualizations. Whether you’re interested in revenue growth by product line over the last 20 years or customer satisfaction trends, Chartify has the answers.
No more spending hours writing complex queries or manually coding up charts. Just ask, and Chartify will deliver.
Chartify provides you with a user-friendly app that allows you to access your charts anytime, anywhere. Whether you’re in the office, at home, or on the go, you can launch the Chartify app and dive into your data visualization journey.
Experience the power of Chartify in the palm of your hand.
Unfortunately, the provided content does not mention any pricing information for Chartify. However, Chartify offers various pricing models and plans to cater to different user needs.
From free tiers for personal users to enterprise plans for large organizations, Chartify has a pricing plan that suits your requirements. Contact Chartify for more information on their pricing options.
A: Absolutely! While Chartify’s AI algorithms generate charts for you, you have full control over customization.
You can adjust colors, labels, legends, and other visual elements to match your preferences and branding.
A: Yes, Chartify offers various sharing options.
You can share your charts via email, generate embeddable codes for websites and blogs, or even export them as image files for presentations and reports.
A: Chartify is designed to handle real-time data visualization.
Whether you’re monitoring stock prices, website traffic, or any other dynamic data, Chartify can update your charts in real-time, providing you with the most up-to-date insights.
In conclusion, Chartify is a game-changer in the world of data visualization. With its AI-generated charts, seamless data upload, and intuitive interface, Chartify empowers users to unlock the full potential of their data.
Whether you’re a data analyst, a business owner, or a student, Chartify is your go-to tool for creating beautiful and insightful charts. Say goodbye to the days of complex chart editors and manual coding – Chartify is here to simplify your data visualization journey.

Are you tired of juggling multiple advertising platforms and spending countless hours on reporting? Say goodbye to the hassle and

Are you looking for a powerful AI tool that can revolutionize your workflow and enhance your decision-making process? Look no

Are you tired of struggling with incomplete and inaccurate data? Do you wish there was a way to streamline your

Are you tired of writing complex SQL queries? Do you wish there was an easier way to generate SQL code

Are you tired of spending hours brainstorming content ideas and crafting compelling articles? Do you wish there was a tool

Are you tired of spending countless hours creating and managing content for your business? Look no further! Introducing Oppflow, the
❌ Please Login to Bookmark!