
Research PAL
Are you tired of spending hours researching and struggling to generate high-quality content? Introducing the AI-Powered Research Assistant for Google
Are you looking for a powerful data visualization tool that will bring your data to life? Look no further than Highcharts!
With its robust features and user-friendly interface, Highcharts is the ultimate solution for creating stunning and interactive charts and graphs.
Transitioning from raw data to meaningful insights can be a daunting task, but Highcharts simplifies the process by offering a wide range of features that cater to every data visualization need. Whether you’re a data analyst, a business owner, or a developer, Highcharts has something to offer for everyone.
In this review, we’ll dive into the key features of Highcharts and explore how they can benefit you in real-world scenarios. From dynamic chart types to advanced customization options, Highcharts empowers you to present your data in the most compelling and informative way possible.
Highcharts provides a vast array of chart types, including line charts, bar charts, pie charts, and more. What sets Highcharts apart is its interactive nature, allowing users to explore and interact with the data effortlessly.
With zooming, panning, and hovering capabilities, users can easily drill down into their data and gain deeper insights.
Imagine you’re analyzing sales data for different product categories. Highcharts’ interactive charts enable you to zoom in on specific time periods or hover over data points to view detailed information.
This level of interactivity not only enhances the user experience but also facilitates better data understanding and decision-making.
No two datasets are the same, and Highcharts understands the importance of customization. With a wide range of configuration options, you can tailor your charts to match your specific requirements and branding.
From colors and fonts to labels and tooltips, Highcharts offers granular control over every aspect of your visualization.
For instance, you can customize the colors of your chart elements to align with your company’s branding guidelines. You can also add custom labels and tooltips to provide additional context and clarity to your data.
This level of customization empowers you to create visually stunning and on-brand charts that resonate with your audience.
In today’s fast-paced world, staying up to date with real-time data is crucial for making informed decisions. Highcharts allows you to seamlessly integrate real-time data streams into your charts, enabling you to monitor and visualize live data as it updates.
Suppose you’re monitoring website traffic in real-time. With Highcharts, you can easily connect your data source and visualize the incoming data as it happens.
This real-time data streaming capability provides you with up-to-the-minute insights, empowering you to respond quickly to changing trends and patterns.
Sharing your insights with others is an essential part of data analysis. Highcharts simplifies this process by offering various exporting options.
Whether you need to save your chart as an image, export it as a PDF, or share it as an interactive web page, Highcharts has got you covered.
Let’s say you’ve created a compelling sales dashboard that you want to share with your team. With Highcharts, you can easily export the dashboard as an image and include it in a presentation.
Alternatively, you can export it as an interactive web page and share the URL with your colleagues, allowing them to explore the data on their own.
Highcharts offers flexible pricing plans to accommodate different user needs. Whether you’re an individual, a small business, or an enterprise, there’s a plan that suits your requirements.
The Basic plan is perfect for individuals and small businesses who need the core features of Highcharts. It provides access to essential chart types, customization options, and community support.
This plan is an excellent choice if you’re just getting started with data visualization.
The Professional plan is designed for teams and businesses that require advanced features and dedicated support. In addition to all the features in the Basic plan, the Professional plan offers premium chart types, priority support, and access to Highcharts experts.
If you’re working on complex data projects or need personalized assistance, the Professional plan is the way to go.
For large enterprises and organizations with high-volume data needs, the Enterprise plan is the ultimate solution. Along with all the features in the Professional plan, the Enterprise plan provides unlimited access to all chart types, advanced data handling capabilities, and 24/7 priority support.
If you’re dealing with massive datasets or require round-the-clock support, the Enterprise plan is the best fit for your organization.
Absolutely! Highcharts offers extensive documentation and APIs that allow seamless integration with various data sources, including databases, APIs, and CSV files.
You can easily connect Highcharts to your existing data infrastructure and visualize your data with ease.
Yes, Highcharts is fully responsive and compatible with all major mobile devices and browsers. Whether you’re accessing your charts on a smartphone, tablet, or desktop, Highcharts ensures a smooth and consistent user experience across different devices.
Absolutely! Highcharts provides a comprehensive set of tools and features for building interactive dashboards.
With its dynamic chart types, drill-down capabilities, and real-time data streaming, you can create engaging and informative dashboards that empower users to explore and analyze data on their own.
In conclusion, Highcharts is a powerful data visualization tool that offers a wide range of features to transform your data.

Are you tired of spending hours researching and struggling to generate high-quality content? Introducing the AI-Powered Research Assistant for Google
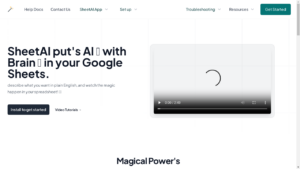
Are you tired of spending hours manually entering data and performing repetitive tasks in your Google Sheets? Wish there was
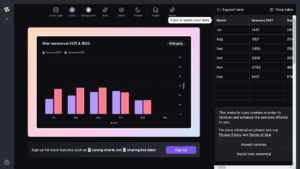
Are you looking for a game-changing AI tool that can revolutionize your business? Look no further than Graphy HQ! This
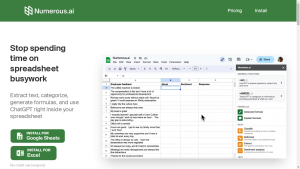
Are you tired of spending hours performing repetitive tasks in spreadsheets? Imagine if you had an AI-powered tool that could
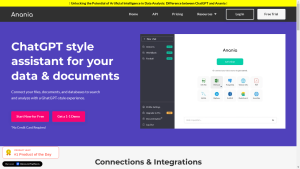
Are you looking for a powerful AI tool to revolutionize decision-making in your organization? Look no further than Anania, a

Are you tired of querying one-by-one on a chat interface? Do you wish there was a way to bulk process
❌ Please Login to Bookmark!